Chi-Square Test for Independence
总结自:
- Chi: [kaɪ]
其实还有 Chi-square test for variance in a normal population 以及 Chi-squared distribution,这里不涉及。
What is a chi-square test
A chi-square test is also referred to as $\chi^2$ test ($\chi$ 这个符号在 latex 里就是 \chi).
The test is applied when you have two categorical variables from a single population. It is used to determine whether these two categorical variables are independent.
Digress: What is a categorical variable?
Variables can be classified as categorical (aka, qualitative) or quantitative (aka, numerical).
- Categorical variables take on values that are names or labels. E.g.
- the color of a ball (red, green, blue, etc.)
- the breed of a dog (collie, shepherd, terrier, etc.)
- Quantitative variables represent a measurable quantity. E.g.
- the population of a city
When to Use Chi-Square Test for Independence
The test procedure is appropriate when the following conditions are met:
- The sampling method is simple random sampling.
- The variables under study are each categorical.
- If sample data are displayed in a contingency table, the expected frequency count for each cell of the table is at least 5.
State the Hypotheses
Given variable $A$ (which has $r$ levels), and variable $B$ (which has $c$ levels),
- $H_0$: variable $A$ and variable $B$ are independent.
- $H_a$: variable $A$ and variable $B$ are not independent.
Analyze Sample Data
- Degrees of freedom: $DF = (r - 1) * (c - 1)$
- Expected frequencies: $E_{r,c} = \frac{n_r * n_c}{n}$
- $E_{r,c}$ is the expected frequency count for level $r$ of variable $A$ and level $c$ of variable $B$
- $n_r$ is the total number of sample observations at level $r$ of variable $A$
- $n_c$ is the total number of sample observations at level $c$ of variable $B$
- $n$ is the total sample size
- Test statistic: $\chi^2 = \sum{\left [ \frac{(O_{r,c} - E_{r,c})^2}{E_{r,c}} \right ]}$
- $O_{r,c}$ is the observed frequency count for level $r$ of variable $A$ and level $c$ of variable $B$
- p-value: 计算时需要 $DF$ 和 $\chi^2$ 两个值,可以使用 Chi-Square Calculator: Online Statistical Table
Example
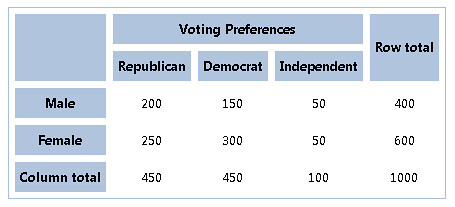
Question: Is there a gender gap? Do the men’s voting preferences differ significantly from the women’s preferences?
- $H_0$: “Gender” and “Voting Preference” are independent.
- $H_a$: “Gender” and “Voting Preference” are not independent.
查表得 $P(DF=3, \chi^2>16.2) = 0.0003$.
Since the p-value (0.0003) is less than the significance level (0.05), we cannot accept the null hypothesis. Thus, we conclude that there is a relationship between gender and voting preference.
留下评论