PR Curve
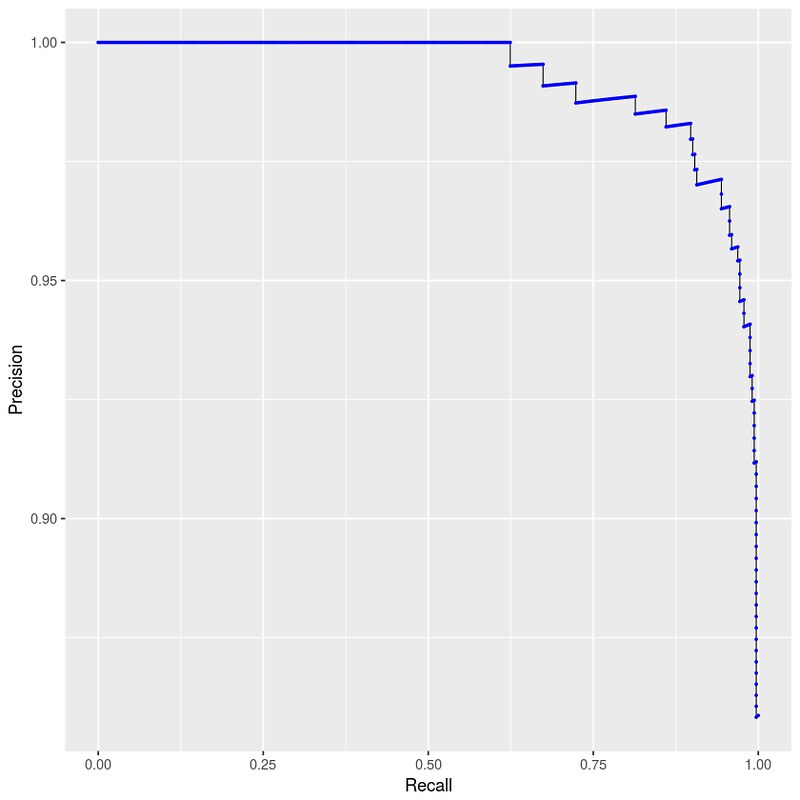
1. Axes
- x-axis 是 $\text{Recall} = \frac{TP}{TP+FN} = \frac{TP}{P}$ (i.e. $\text{True Positive Rate}$)
- 没错,和 ROC 的 y-axis 一样
- y-axis 是 $\text{Precision} = \frac{TP}{TP+FP}$ (a.k.a. $\text{Positive Predictive Value}$)
2. 序列规律
import pandas as pd
import numpy as np
from sklearn.datasets import load_breast_cancer
from sklearn.linear_model import LogisticRegression
from sklearn.metrics import precision_recall_curve

bc = load_breast_cancer()

feat = pd.DataFrame(bc['data'])
feat.columns = bc['feature_names']
label = pd.Series(bc['target'])

train_X = feat.loc[0:99, ]  # contrary to usual python slices, both the start and the stop are included in .loc!
train_y = label.loc[0:99]
test_X = feat.loc[100:, ]
test_y = label.loc[100:]

lr_config = dict(penalty='l2', C=1.0, class_weight=None, random_state=1337,
                 solver='liblinear', max_iter=100, verbose=0, warm_start=False, n_jobs=1)
lr = LogisticRegression(**lr_config)
lr.fit(train_X, train_y)

proba_test_y = lr.predict_proba(test_X)[:, 1]

precision, recall, threshold = precision_recall_curve(test_y, proba_test_y, pos_label=1)
这里有一点需要注意:precision, recall, threshold 这三个 array 的长度是不一样的!
>>> print(len(precision), len(recall), len(threshold))
376 376 375
从 源代码 的最后一行来看:
def precision_recall_curve(y_true, probas_pred, pos_label=None, sample_weight=None):
    fps, tps, thresholds = _binary_clf_curve(y_true, probas_pred,
                                             pos_label=pos_label,
                                             sample_weight=sample_weight)

    precision = tps / (tps + fps)
    recall = tps / tps[-1]

    # stop when full recall attained
    # and reverse the outputs so recall is decreasing
    last_ind = tps.searchsorted(tps[-1])
    sl = slice(last_ind, None, -1)
    return np.r_[precision[sl], 1], np.r_[recall[sl], 0], thresholds[sl]
(recall=0, precision=1)这个点完全是人为添加上去的,但是没有添加对应的threshold的值- 这里
np.r_你姑且理解为 concat 就好了
- 这里
这里有几个点需要搞清楚:
- 假设
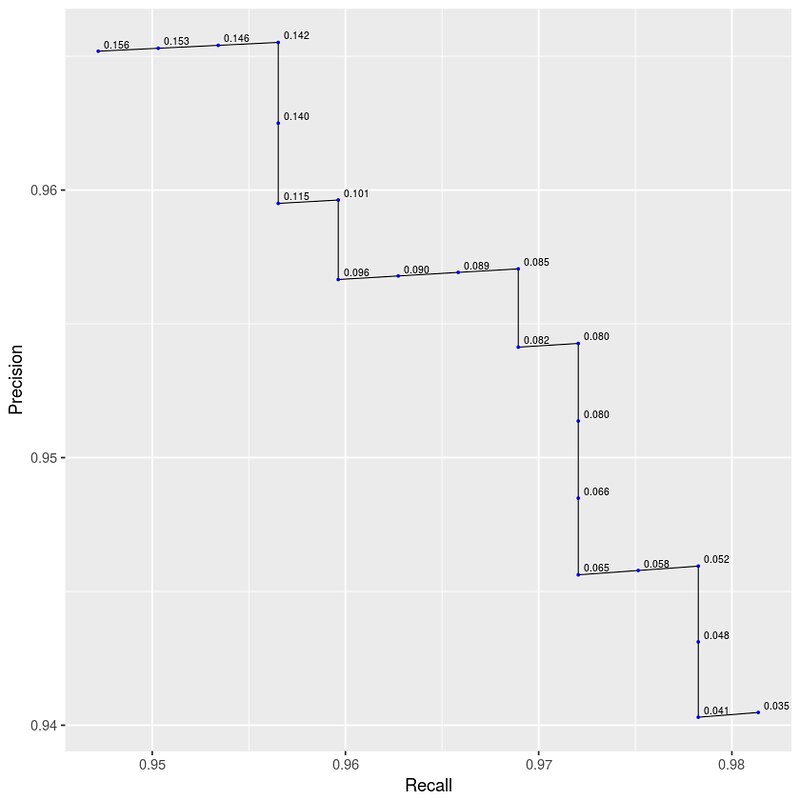
len(recall) == len(precision) == n,那么:recall[0:n-2]、precision[0:n-2]与thresholds[0:n-2]是一一对应的 thresholds是递增的,从 0 到非常接近 1recall是随着thresholds递增而单调递减的,这在 ROC Curve: my interpretation 里就已经讨论过了precision并没有随着thresholds递增而单调递减,但总体是下降趋势
所以 (recall=0, precision=1) 这个点其实是 PR curve 上的第一个点,直觉上它应该对应 threshold=1,但是严格按照定义来说:
threshold=1时,没有 prediction 为 positive,所以 $TP$ 和 $FP$ 更是无从谈起,全都是 0,进而 $\text{Precision} =\frac{TP}{TP+FP} = \frac{0}{0}$,undefined
我觉得 scikit-learn 这么处理完全是为了画图上的方便。像 Introduction to the precision-recall plot 里提到的 “Estimating the first point from the second point” 方法也是很有道理的,但是明显 scikit-learn 采取了 “直接设定第一个点为 (recall=0, precision=1)” 这么一个简单粗暴的做法。
为了方便做示例,我们也人为添加一个 threshold=1:
thresholds = np.r_[thresholds, 1]

df = pd.DataFrame({"Precision": precision, "Recall": recall, "Decision Threshold":thresholds})
df.to_csv("auprc_test.tsv", sep='\t', index=False, header=True)
>>> library(ggplot2)
>>> auprc_df <- read.table("auprc_test.tsv", header=TRUE, sep="\t", stringsAsFactors=FALSE)
>>> colnames(auprc_df)
'Decision.Threshold' 'Precision' 'Recall'
>>> p <- ggplot(data=auprc_df, mapping=aes(x=Recall, y=Precision)) +
         geom_path(size=0.3) + geom_point(size=0.4, color=I("blue"))
>>> p
这里用 geom_path 而不是 geom_line 的原因在 ggplot2: use geom_line() carefully when your x-axis data are descending 里有说明。

标上 thesholds 数据看看:
>>> p <- ggplot(data=auprc_df[40:60,], mapping=aes(x=Recall, y=Precision)) +
         geom_path(size=0.3) + geom_point(size=0.4, color=I("blue"))
>>> p + geom_text(aes(label=sprintf("%0.3f", round(Decision.Threshold, digits = 3))), hjust=-0.2, vjust=-0.4, size=2.2)

3. 为什么 precision 没有单调性
当 threshold 从 $t_j$ 变化到 $t_{j+1}$ 时:
- $t_j > t_{j+1}$
- $\lbrace h(x_i) = 1 \rbrace \subseteq \lbrace h(x_{i+1}) = 1 \rbrace $
- threshold 减小,predict 为 positive 的数量只多不少
- 尤其当 $t = 0$ 时,$\vert \lbrace h(x_i) = 1 \rbrace \vert = n$
- 对 $\lbrace \text{Precision}_j \rbrace$ 而言:
- $FP \rvert_{t_j} \leq FP \rvert_{t_{j+1}}$
- $\lbrace h(x_{i+1}) = 1 \rbrace \setminus \lbrace h(x_i) = 1 \rbrace$ 是新增的 predict 为 positive 的 cases,其中必然有 0 个或者若干个新增的 False Positive
- $TP \rvert_{t_j} \leq TP \rvert_{t_{j+1}}$
- $\lbrace h(x_{i+1}) = 1 \rbrace \setminus \lbrace h(x_i) = 1 \rbrace$ 是新增的 predict 为 positive 的 cases,其中必然有 0 个或者若干个新增的 True Positive
- 但无法保证有 $\frac{TP \rvert_{t_j}}{TP\rvert_{t_j} + FP \rvert_{t_j}} \leq \frac{TP \rvert_{t_{j+1}}}{TP \rvert_{t_{j+1}} + FP \rvert_{t_{j+1}}}$
- $FP \rvert_{t_j} \leq FP \rvert_{t_{j+1}}$
4. Baseline
当 threshold 为 0 时,所有的 prediction 都是 positive,从而 $TP = P, FP = N$,进而 $\text{Precision} =\frac{TP}{TP+FP} = \frac{P}{P+N} = \text{class balance}$。
我们接着用 ROC Curve: my interpretation 里 random guess 的例子:
Similarly, if you predict a random assortment of 0’s and 1’s, let’s say 90% 1’s.
- 你在 $P$ 上预测了 90% 为 Positive,这些全部都是 True Positive,所以 $TP = 0.9 * P$
- 你在 $N$ 上预测了 90% 为 Positive,这些全部都是 False Positive,所以 $FP = 0.9 * N$
- 你在 $P$ 上预测了 10% 为 Negative,这些全部都是 False Negative,所以 $FN = 0.1 * P$
- $\therefore \text{Recall} = \frac{TP}{P} = 0.9, \text{Precision} = \frac{TP}{TP+FP} = \frac{P}{P+N} = \text{class balance}$
所以你会得到一个点 $(recall=0.9, precision=\text{class_balance})$。无数这样的 random guessing predictor 就构成了一条 baseline $y=\text{class balance}$。
考虑到 precision 并没有单调递减,所以可能出现 precision below baseline 的情况。
如果 AUPRC > baseline,说明我们的 predictor 好过 random guess。
最后,并没有 “baseline 以上 AUPRC” 这种指标。
5. PRC is sensitive to class balance
换言之,PRC 更适用于 imbalanced data。还是用 ROC Curve: my interpretation 里的例子:
- Balanced dataset: $P=1000, N=1000$; classifier $A$ predicts at threashold $t$: $TP=500, FP=160$
- Imbalanced dataset: $P=1000, N=10000$; classifier $B$ predicts at the same threashold $t$: $TP=500, FP=1600$
如果在所有的 theashold 上都有这样类似的关系,i.e. $TP_A = TP_B, FP_A = \frac{1}{10} FP_B$,那么这两个 classifiers 的 ROC 是完全一样的
在这种设定下:
- $\text{Recall}_A = \text{Recall}_B = \frac{500}{1000} = 0.5$
- $\text{Precision}_A = \frac{500}{500+160} = 0.7576, \, \text{baseline}_A = \frac{1000}{1000+1000} = 0.5$
- $\text{Precision}_B = \frac{500}{500+1600} = 0.2381, \, \text{baseline}_B = \frac{1000}{1000+10000} = 0.091$
可以预见会有 $\text{AUPRC}_A > \text{AUPRC}_B$。
从定义上我们也可以看出,PRC 强调的是 ”$TP$ 在所有我所做的 prediction 中的比例”。
6. scikit-learn 如何计算 AUPRC
6.1 No interpolation
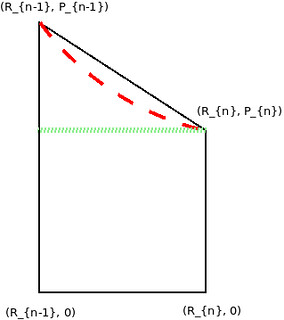
因为我们只有有限的点,没有曲线公式可以去积分,所以只能近似估算 PRC 下的面积。考虑这么一个小长条的面积:

- Linear Interpolation: 计算梯形(trapezoid)的面积,$\text{A} = \frac{P_{n} + P_{n-1}}{2} \times (R_{n} - R_{n-1})$
- Non-linear Interpolation: Introduction to the precision-recall plot 提到 linear interpolation 太 optimistic,得到的 estimate 偏大,所以它可能是类似红色曲线下的面积。这种 interpolation 方法具体看那篇文章,这里不展开
- No Interpolation:计算曲线内矩形的面积(绿色虚线下的面积)(考虑到 Precision 是下降趋势,所以这里默认 $P_{n-1} > P_{n}$)
average_precision_score() 用的是 No Interpolation:
6.2 average 参数: micro / macro / None / samples / weighted
知道怎么算积分之后,我们的目的就变成:根据 y_true 和 y_score 算出 precision 和 recall。
不过在此之前我们先来看下 sklearn 对 y_true 类型的判断,在 type_of_target(y) 函数里:
continuous:yis an array-like of floats that are not all integers, and is 1d or a column vector.continuous-multioutput:yis a 2d array of floats that are not all integers, and both dimensions are of size > 1.binary:ycontains <= 2 discrete values and is 1d or a column vector.multiclass:ycontains more than two discrete values, is not a sequence of sequences, and is 1d or a column vector.multiclass-multioutput:yis a 2d array that contains more than two discrete values, is not a sequence of sequences, and both dimensions are of size > 1.multilabel-indicator:yis a label indicator matrix, an array of two dimensions with at least two columns, and at most 2 unique values.unknown:yis array-like but none of the above, such as a 3d array, sequence of sequences, or an array of non-sequence objects.
>>> import numpy as np
>>> type_of_target([0.1, 0.6])
'continuous'
>>> type_of_target([1, -1, -1, 1])
'binary'
>>> type_of_target(['a', 'b', 'a'])
'binary'
>>> type_of_target([1.0, 2.0])
'binary'
>>> type_of_target([1, 0, 2])
'multiclass'
>>> type_of_target([1.0, 0.0, 3.0])
'multiclass'
>>> type_of_target(['a', 'b', 'c'])
'multiclass'
>>> type_of_target(np.array([[1, 2], [3, 1]]))
'multiclass-multioutput'
>>> type_of_target([[1, 2]])
'multiclass-multioutput'
>>> type_of_target(np.array([[1.5, 2.0], [3.0, 1.6]]))
'continuous-multioutput'
>>> type_of_target(np.array([[0, 1], [1, 1]]))
'multilabel-indicator'
我们再看 average_precision_score() 的参数类型:
"""
y_true : array, shape = [n_samples] or [n_samples, n_classes]
y_score : array, shape = [n_samples] or [n_samples, n_classes]
"""
可见它是支持 multilabel-indicator 类型的。但是它内部会调用 precision_recall_curve() 的,而 precision_recall_curve 是不支持 multilabel-indicator 的,它只接收 1-d array:
"""
y_true : array, shape = [n_samples]
"""
所以我们可以预见 average_precision_score() 内部会把 2-d 转成 1-d。我们用下面这组数据来试一试:
y_true = np.array([[1, 0], [1, 0], [0, 1], [0, 1], [0, 1]])
y_score = np.array([[0.5, 0.5], [0.6, 0.4], [0.7, 0.3], [0.8, 0.2], [0.9, 0.1]])
sample_weight = np.array([1, 1, 2, 2, 2])
6.2.1 average = "micro"
not_average_axis = 1
score_weight = sample_weight
average_weight = None

if average == "micro":
    if score_weight is not None:
        score_weight = np.repeat(score_weight, y_true.shape[1])  # y_true.shape[1] == 2
    y_true = y_true.ravel()
    y_score = y_score.ravel()

"""
y_true == np.array([1, 0, 1, 0, 0, 1, 0, 1, 0, 1])
y_score == np.array([0.5, 0.5, 0.6, 0.4, 0.7, 0.3, 0.8, 0.2, 0.9, 0.1])
sample_weight == np.array([1, 1, 1, 1, 2, 2, 2, 2, 2, 2])
"""

if y_true.ndim == 1:
    y_true = y_true.reshape((-1, 1))

if y_score.ndim == 1:
    y_score = y_score.reshape((-1, 1))

"""
y_true == np.array([[1],
                    [0],
                    [1],
                    [0],
                    [0],
                    [1],
                    [0],
                    [1],
                    [0],
                    [1]])
y_score == np.array([[0.5],
                     [0.5],
                     [0.6],
                     [0.4],
                     [0.7],
                     [0.3],
                     [0.8],
                     [0.2],
                     [0.9],
                     [0.1]])
"""

n_classes = y_score.shape[not_average_axis]  # 1
score = np.zeros((n_classes,))  # array([0])
for c in range(n_classes):
    y_true_c = y_true.take([c], axis=not_average_axis).ravel()  # np.array([1, 0, 1, 0, 0, 1, 0, 1, 0, 1])
    y_score_c = y_score.take([c], axis=not_average_axis).ravel()  # np.array([0.5, 0.5, 0.6, 0.4, 0.7, 0.3, 0.8, 0.2, 0.9, 0.1])
    score[c] = binary_metric(y_true_c, y_score_c, sample_weight=score_weight)

"""
score == np.array([0.36111])
"""

# Average the results
if average is not None:
    return np.average(score, weights=average_weight)  # return 0.36111
else:
    return score
average = "micro"的作用就是把原来的 5 个 labels 和 5 个 scores 扩展成了 10 个 labels 和 10 个 scores- 最后一步,因为
score是一个 float,np.average没有作用
sample_weight 参数在 precision_recall_curve() 函数中的作用在于:影响 $TP$ 的计算方法。代码在 _binary_clf_curve:
# make y_true a boolean vector
y_true = (y_true == pos_label)

......

tps = stable_cumsum(y_true * weight)[threshold_idxs]
一般来说,sum(y_true == pos_label) 的数量就是 $TP$,但是加上了 weight 之后,sum((y_true == pos_label) * weight) 才是 $TP$。比如:
y_true == [1, 1, 1, 0]; weight = None$\Rightarrow TP = 1 + 1 + 1 = 3$y_true == [1, 1, 1, 0]; weight = [1, 1, 2, 2]$\Rightarrow TP = 1\times1 + 1\times1 + 1\times2 = 4$
6.2.2 average = "macro" / average = None
not_average_axis = 1
score_weight = sample_weight
average_weight = None

if y_true.ndim == 1:  # ==2, False
    y_true = y_true.reshape((-1, 1))

if y_score.ndim == 1: # ==2, False
    y_score = y_score.reshape((-1, 1))

n_classes = y_score.shape[not_average_axis]  # 2
score = np.zeros((n_classes,))  # array([0, 0])
for c in range(n_classes):
    y_true_c = y_true.take([c], axis=not_average_axis).ravel()
    y_score_c = y_score.take([c], axis=not_average_axis).ravel()
    score[c] = binary_metric(y_true_c, y_score_c, sample_weight=score_weight)

"""
score == np.array([0.19642857, 0.63888889])
"""

# Average the results
if average is not None:
    return np.average(score, weights=average_weight)  # return 0.41766
else:
    return score
average = "macro"是把y_true[:, 0]和y_true[:, 1]各算了一个 AUPRC,然后按average_weight取平均- 但是
average = "macro"时,average_weight is None,所以相当于return sum(score) / len(score)
- 但是
average = None就是直接返回score == np.array([0.19642857, 0.63888889]), 没有取平均;而且是多维的,不是个 scalar
6.2.3 average = "weighted"
not_average_axis = 1
score_weight = sample_weight
average_weight = None

elif average == 'weighted':
    if score_weight is not None:
        average_weight = np.sum(np.multiply(y_true, np.reshape(score_weight, (-1, 1))), axis=0)
    else:
        average_weight = np.sum(y_true, axis=0)  # np.array([2, 3])
    if average_weight.sum() == 0:  # sum(y_true) == 0, i.e. no TP, precision 恒为 0
        return 0

"""
average_weight == np.array([2, 6])

Positives 的总 weight 为 2,Negatives 的总 weight 为 6
"""

if y_true.ndim == 1:  # ==2, False
    y_true = y_true.reshape((-1, 1))

if y_score.ndim == 1:  # ==2, False
    y_score = y_score.reshape((-1, 1))

n_classes = y_score.shape[not_average_axis]  # 2
score = np.zeros((n_classes,))  # array([0, 0])
for c in range(n_classes):
    y_true_c = y_true.take([c], axis=not_average_axis).ravel()
    y_score_c = y_score.take([c], axis=not_average_axis).ravel()
    score[c] = binary_metric(y_true_c, y_score_c, sample_weight=score_weight)

"""
score == np.array([0.19642857, 0.63888889])
"""

# Average the results
if average is not None:
    return np.average(score, weights=average_weight)  # return 0.528274
else:
    return score
average = "weighted"和average = "macro"的基本逻辑是一样的,也是把y_true[:, 0]和y_true[:, 1]各算了一个 AUPRC,然后按average_weight取平均- 但是
average = "weighted"时,average_weight是一定有值的,不可能为Nonescore_weight is None时,average_weight == [P, N]score_weight is not None时,average_weight == [sum(P's weights), sum(N's weights)]
6.2.4 average = "samples"
not_average_axis = 1
score_weight = sample_weight
average_weight = None

elif average == 'samples':
    # swap average_weight <-> score_weight
    average_weight = score_weight  # np.array([1, 1, 2, 2, 2])
    score_weight = None
    not_average_axis = 0

if y_true.ndim == 1:  # ==2, False
    y_true = y_true.reshape((-1, 1))

if y_score.ndim == 1:  # ==2, False
    y_score = y_score.reshape((-1, 1))

n_classes = y_score.shape[not_average_axis]  # 5
score = np.zeros((n_classes,))  # np.array([0, 0, 0, 0, 0])
for c in range(n_classes):
    y_true_c = y_true.take([c], axis=not_average_axis).ravel()  # y_true_c == y_true[c, :]
    y_score_c = y_score.take([c], axis=not_average_axis).ravel()  # y_score_c == y_score[c, :]
    score[c] = binary_metric(y_true_c, y_score_c, sample_weight=score_weight)  # sample_weight is None

"""
score == np.array([0.5, 1, 0.5, 0.5, 0.5])
"""

# Average the results
if average is not None:
    return np.average(score, weights=average_weight)  # return 0.5625
else:
    return score
average = "samples"的作用就是把原来的 5 个 labels 和 5 个 scores 变成了 5 组,每组 2 个 labels 和 2 个 scores- 然后按
sample_weight = None计算了 5 个 AUPRC 值 - 最后按
weights = sample_weight(起始值)取 average
6.2.5 Summary
Given:
y_true = np.array([[1, 0], [1, 0], [0, 1], [0, 1], [0, 1]])
y_score = np.array([[0.5, 0.5], [0.6, 0.4], [0.7, 0.3], [0.8, 0.2], [0.9, 0.1]])
sample_weight = np.array([1, 1, 2, 2, 2])
average = "micro"- expand into 10 labels, 10 scores and 10 weights
- calculate 1 AUPRC with
sample_weight - return this AUPRC
average = "macro"- split into 2 groups:
- 5 labels, 5 scores and 5 weights for Positives
- 5 labels, 5 scores and 5 weights for Negatives
- calculate 2 AUPRC with
sample_weight - return the arithmetic mean of these 2 AUPRC
- split into 2 groups:
average = None- split into 2 groups:
- 5 labels, 5 scores and 5 weights for Positives
- 5 labels, 5 scores and 5 weights for Negatives
- calculate 2 AUPRC with
sample_weight - return these 2 AUPRC
- split into 2 groups:
average = "weighted"- split into 2 groups:
- 5 labels, 5 scores and 5 weights for Positives
- 5 labels, 5 scores and 5 weights for Negatives
- calculate 2 AUPRC with
sample_weight - if
sample_weight is None, weights are supports, i.e. the numbers of true labels in each group - if
sample_weight is not None, weights aresample_weighted supports, i.e. the total weights of true labels in each group - return the weighted mean of these 2 AUPRC
- split into 2 groups:
average = "samples- treat each prediction as a group:
- 2 labels, 2 scores and 2 weights
- totally 5 groups
- calculate 5 AUPRC without
sample_weight - return the
sample_weighted mean of these 5 AUPRC
- treat each prediction as a group:
留下评论